
End of month. You run the numbers.
Revenue looks reasonable. The team delivered. Every project got out the door. And yet, when you look at what actually landed in margin, something doesn’t add up. The gap between what you invoiced and what you expected to keep is wider than it should be, and you can’t point to a single line item that explains it.
You check the obvious suspects. Scope creep. Over-servicing. A project that ran long. You find some of it. Not all of it.
The rest disappeared somewhere the balance sheet can’t see.
The Cost That Has No Category
Every agency has costs that show up clearly on a P&L. Salaries. Software subscriptions. Freelancers. Rent. These are visible, trackable, and managed because they have a name and a number attached to them.
But there’s an entire category of cost that never appears anywhere, despite being present in every creative business, every month, without exception. It doesn’t show up as an expense. It doesn’t show up as a write-off. It shows up as margin that should exist but doesn’t, hours paid for, capacity deployed, but output never converted into something billable.
Call it the Silent Tax.
Unlike rent or software, the Silent Tax isn’t fixed. It’s variable, and it scales directly with team size and project complexity. The more people you have, the more projects you’re running, the more the tax compounds quietly in the background. According to a 2026 analysis of agency profitability, the agencies that struggle most aren’t necessarily working less hard, they’re measuring the wrong things or measuring nothing at all. Most agencies have 10% utilisation hiding in inefficient processes. That 10% isn’t absence. It’s presence: present, paid, and consumed by friction before it ever reaches a client deliverable.
What the Silent Tax Is Actually Made Of
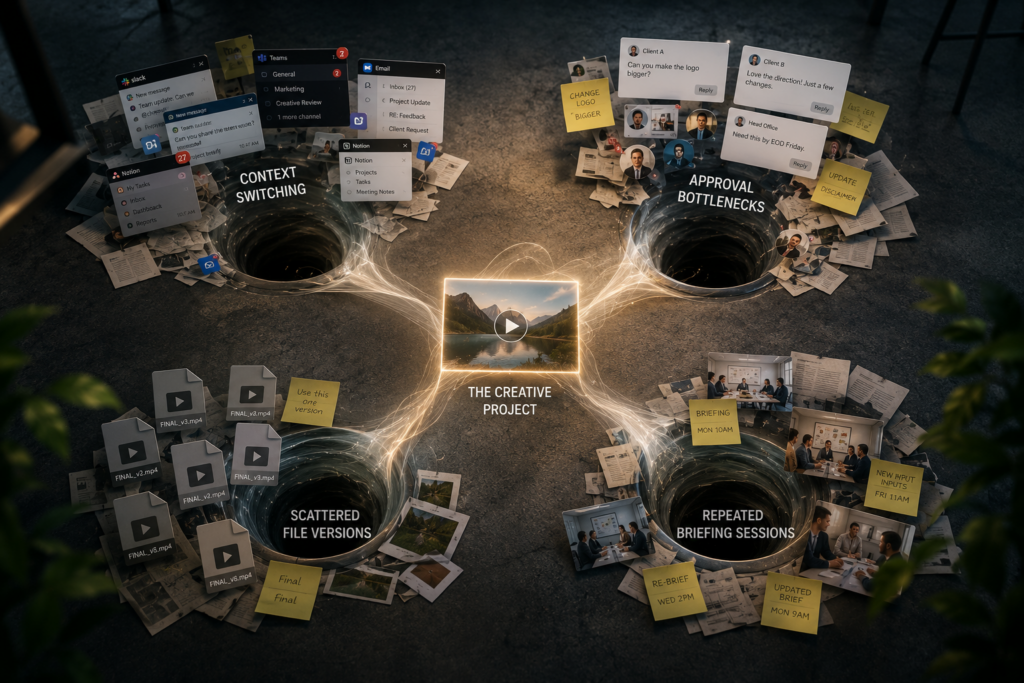
The Silent Tax isn’t one thing. It’s a collection of smaller costs that each feel like a normal part of creative work, because nobody has ever named them as costs at all.
The Switch Tax. Every time a creative professional abandons a task to answer a message, locate a file, or check a comment thread, their brain pays a recovery cost to return to where they were. Research shows it takes an average of 23 minutes to fully rebuild focus after a single interruption, and the average knowledge worker switches contexts over 1,200 times a day. Those recovery minutes don’t appear on any timesheet. They get logged as design time, edit time, strategy time. They aren’t. They’re overhead wearing creative clothes.
The Approval Drag. Work gets finished. Then it sits – genuinely complete, waiting for a sign-off that lives between a WhatsApp message, an email thread, and a verbal “looks good” on a call nobody documented. A 2025 analysis of 273 agency leaders by Ignition found that 57% of agencies lose between $1,000 and $5,000 every month to unbilled work alone, and only 1% successfully bill for all out-of-scope work. The Approval Drag contributes directly to this: it extends project timelines, clogs team capacity, and forces senior people to chase status on work that should have closed days ago.
The Version Hunt. Before a single creative decision gets made, someone has to establish which brief is current, which asset is approved, and which version of the deck is the one the client actually signed off on. That search across Google Drive, email, Slack, and wherever the last message landed, burns real time on every project, every day. Sidekick Accounting’s 2026 analysis of agency profit leakage identifies scope creep and process inefficiency as the two most consistent margin killers: “these five-minute jobs add up to days of unbilled time across a year.” The Version Hunt is exactly this, individually small, collectively significant.
The Rebrief Loop. Work gets done, reviewed, and sent back, not because the creative was wrong, but because the original brief was never clearly accessible where the work was actually happening. The team works from memory, from a month-old email, from what they think the client said on a call. The rework isn’t scope creep. It’s the cost of a brief that lived in five places and was clear in none of them.
Running the Numbers Nobody Runs
Here’s a calculation most agency founders have never done, not because the data isn’t available, but because the category has never existed to put the data into.
Take a 10-person creative team. Conservative assumptions:
- Each person loses roughly 90 minutes of productive capacity daily to Switch Tax alone, the recovery time from interruptions across a standard workday
- Each project loses an average of 2–3 days to Approval Drag, work finished but not formally closed, consuming ongoing attention from account managers and designers alike
- Each task begins with an average of 20 minutes of Version Hunt before active creative work can start
- Roughly 1 in 4 tasks requires a significant re-explanation or re-brief because the original context wasn’t accessible at the point of execution
Across a 10-person team working 22 days a month, the Switch Tax alone accounts for approximately 330 hours of lost productive capacity monthly. At an average billing rate of ₹1,500 per hour, that’s ₹4.95 lakhs of revenue capacity consumed by friction, before the Approval Drag, the Version Hunt, or the Re-brief Loop are factored in at all.
Our Context Switch Calculator runs this math for your specific setup, nine questions covering your team size, location, tool stack, and revenue targets, from where your files live to how client feedback currently reaches your team. At the end, it generates a personalised report showing what context switching is actually costing your agency, not an industry average, but a number built from how your team specifically works. Most founders who run it find the output uncomfortable. Not because it’s alarming, but because it’s the first time they’ve seen the cost written down.
Why It Never Shows Up on the P&L

The Silent Tax is invisible on financial reports for a simple reason: it doesn’t look like a cost. It looks like work.
When a designer spends 25 minutes locating the approved logo version before beginning a layout, that time gets logged as design work. When an account manager spends 40 minutes manually chasing a sign-off that should have been a one-click approval, that time gets logged as client management. When a video editor rerenders a sequence because the feedback came through on WhatsApp at 9 PM and the timecode reference was wrong, that time gets logged as post-production.
Bennett Financials’ 2026 analysis of agency profitability puts it plainly: indirect costs – internal meetings, approval chasing, coordination overhead, represent 30-40% of total client servicing costs at most agencies, and are almost never allocated back to individual clients or projects in a standard P&L. The costs are real. The category doesn’t exist. And what doesn’t have a category never gets measured, never gets managed, and never gets fixed.
This is why the margin gap persists even when revenue grows. Move at Pace’s March 2026 agency benchmarks note that agencies consistently hitting 20%+ EBITDA share one habit above all: they track project profitability on every project, not just revenue, but actual profit. The ones who don’t discover the Silent Tax only when the numbers stop making sense. By then, it’s been compounding for years.
What Changes When You Name It
The Silent Tax won’t appear on next month’s P&L regardless of what you do this week. But naming it changes how you run the business around it.
Founders who start treating it as a real cost category, one with a number, a mechanism, and an owner, begin making different decisions. They design workflows that reduce switching rather than just managing its consequences. They evaluate tools on whether they remove friction or add to it. They protect uninterrupted focus time because they now understand what an interruption actually costs, not just in morale, but in margin. They build approval workflows that close cleanly rather than trailing off across three platforms.
The gap between invoiced hours and worked hours starts to close, not because anyone works harder, but because the environment stops quietly consuming the difference.
The Silent Tax has always been there. It just never had a name. And what finally gets named can finally get fixed.
Start by finding out what the Silent Tax is actually costing your team. The ButtonShift Context Switch Calculator asks nine questions about your team, your tool stack, and your revenue targets, then generates a custom report with your specific numbers. Most founders have never seen this figure on any report they run. That’s exactly the point.
Frequently Asked Questions
What is the “Silent Tax” in a creative agency context?
The Silent Tax is the collective cost of friction-driven overhead that consumes paid team hours without converting them into billable output. It includes the time lost to context switching and focus recovery, approval chasing, searching for the right file or brief version, and rework caused by briefs that weren’t clearly accessible when the work was being done. It’s real, it’s consistent, and it never appears on a P&L because it gets logged as productive work time rather than overhead.
How much revenue is the average agency losing to unbilled and inefficient work?
Industry research from Ignition’s 2025 analysis of 273 agency leaders found that 57% of agencies lose between $1,000 and $5,000 every month to unbilled work alone, with 30% losing more than $5,000 monthly. Separate benchmarking data suggests most agencies have roughly 10% of utilisation capacity hidden inside inefficient processes, capacity that’s being paid for but not converted into output or revenue.
Why doesn’t the Silent Tax show up on agency financial reports?
Because it doesn’t present as a cost, it presents as work. Time consumed by switching context, hunting for files, chasing approvals, or redoing work due to unclear briefs all gets logged under productive categories like design, editing, or client management. Without a specific category to capture it, the cost is invisible on standard P&L reports, which is precisely why it goes unmanaged in most agencies.
How do I calculate what the Silent Tax is costing my specific team?
The ButtonShift Context Switch Calculator walks you through nine questions about your team size, location, tool stack, and revenue targets — covering everything from where your files live to how client feedback currently reaches your team. At the end, it generates a personalised report showing what context switching is costing your specific setup, not an industry average.
Here’s a question worth sitting with: if you ran the actual hours your team worked last month against the hours you invoiced for, and then tried to account for where the difference went, would you be able to find it all? Or would some of it simply have vanished into the normal pace of the work?